You now have full control over the layout of your InLoox workspace. Customize the user interface to perfectly match your personal working style:
Customizable Main Navigation
Using the three-dot menu, you can adjust the order of the individual menu items.
- You work a lot with the Track feature? Simply drag it further up.
- Don't need the People section? Just hide it.
- And for even better clarity, you can insert dividers to group content thematically.
Customizable Project Tabs
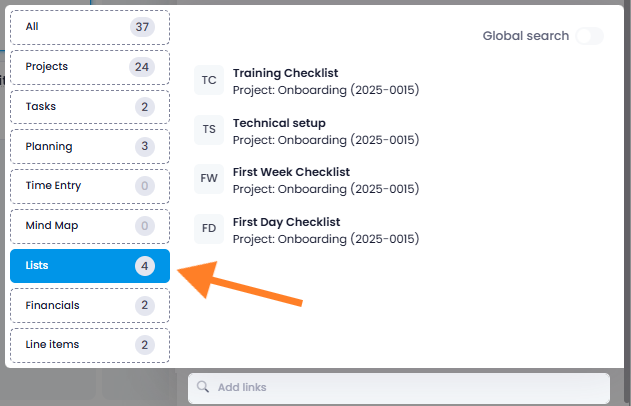
Within a project, you can also decide which tabs are shown and in which order. Whether it's the Manage page, Tasks, Lists, Planning, Mind Maps, Documents, Time, or Financials – simply drag and drop the tabs to the position that suits you best.
Individual Detail Side Panels
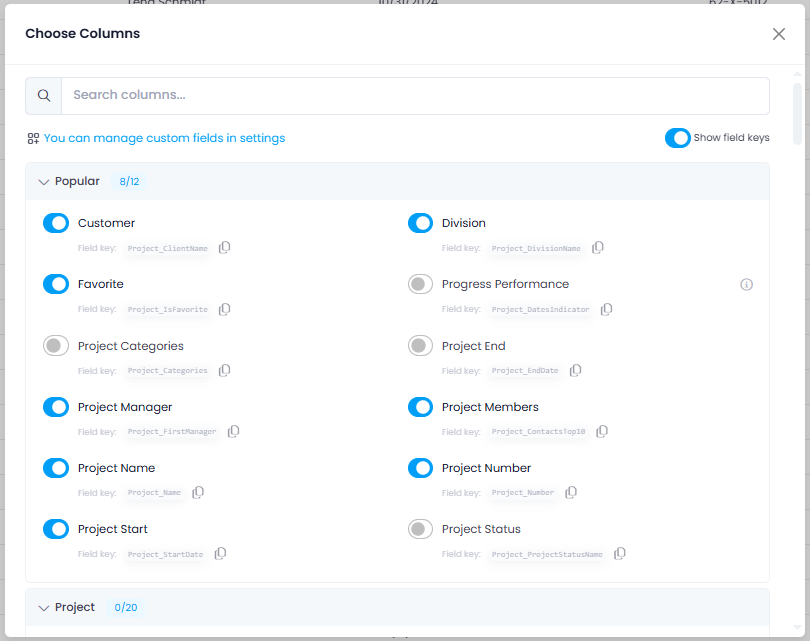
Even on the level of individual tasks, time entries, and more, you can tailor the view to your needs: Move frequently used fields to the top, or hide fields you don't require.
You can make these changes either via the gear icon next to each section or enter layout mode through the three-dot menu to configure everything in detail.
All settings apply only to your personal view. And if you'd like to return to the default layout at any time, you can reset everything with a single click.