5 posts tagged with "area:dashboards"

Dashboards and reports

View All Tags

Dashboard Widgets

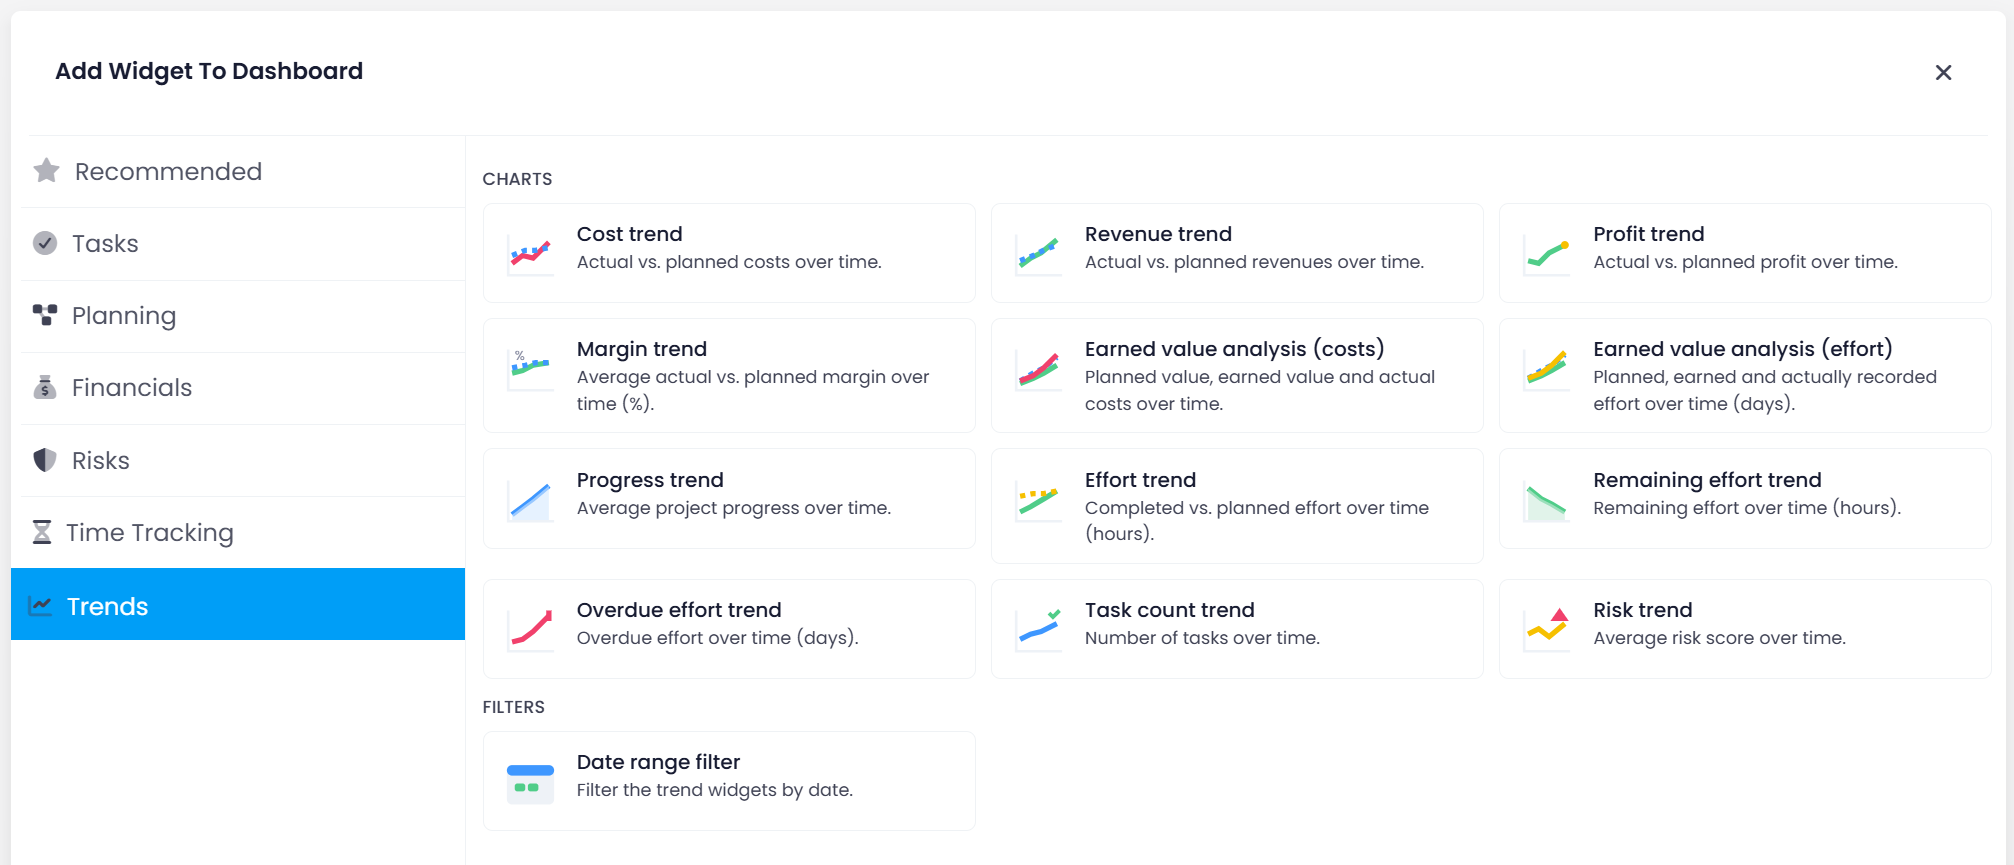
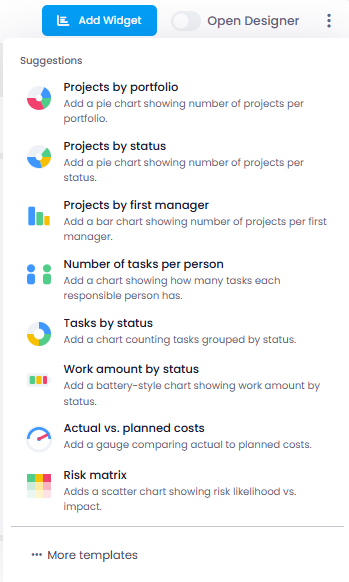
Dashboards can now be created even more easily: via the "Add Widget" button, you can select from numerous templates already linked to the right data sources. This allows you to add meaningful charts with just a few clicks – no expert knowledge required.

The new widgets are available not only in project dashboards, but also in cross-project dashboards. From the overall organization down to the individual project, you always get the exact reports you need.

Create meaningful analyses faster with dashboard widgets

Help article: Dashboards

Project Dashboards: All Key Metrics at a Glance

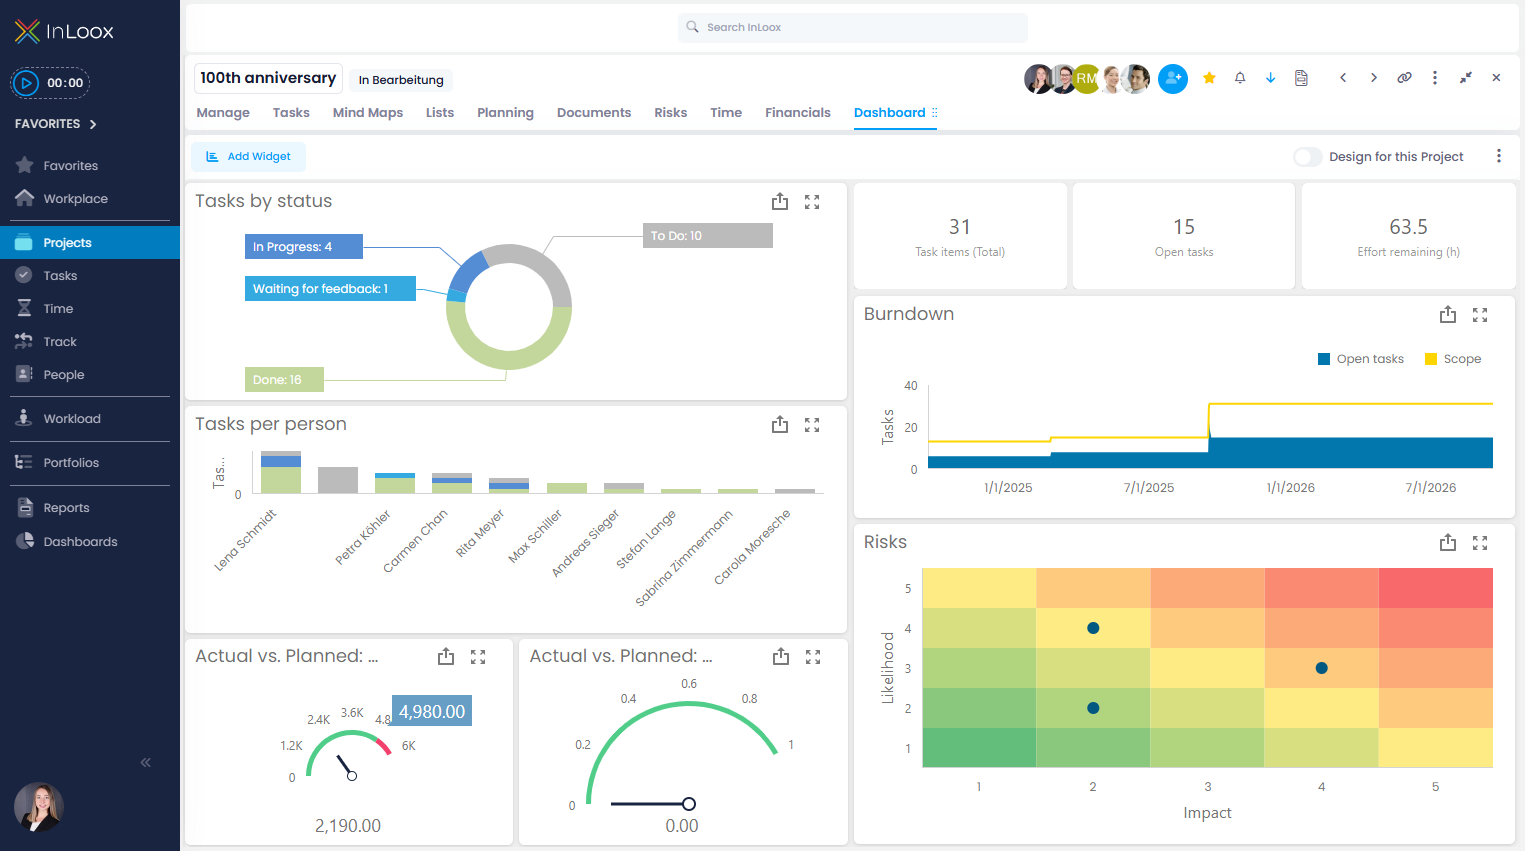
With the new Project Dashboards, you always keep track of each individual project – quickly, transparently, and without detours. In the new "Dashboard" tab, you will find a standard dashboard that presents the most important project metrics:

  • Tasks by status and assignee: Who is working on what, and what's the progress
  • Burndown chart: How open tasks evolve over time
  • Planned vs. actual costs and revenues: Financial transparency at a glance
  • Risk matrix: Impact and likelihood of potential risks always visible

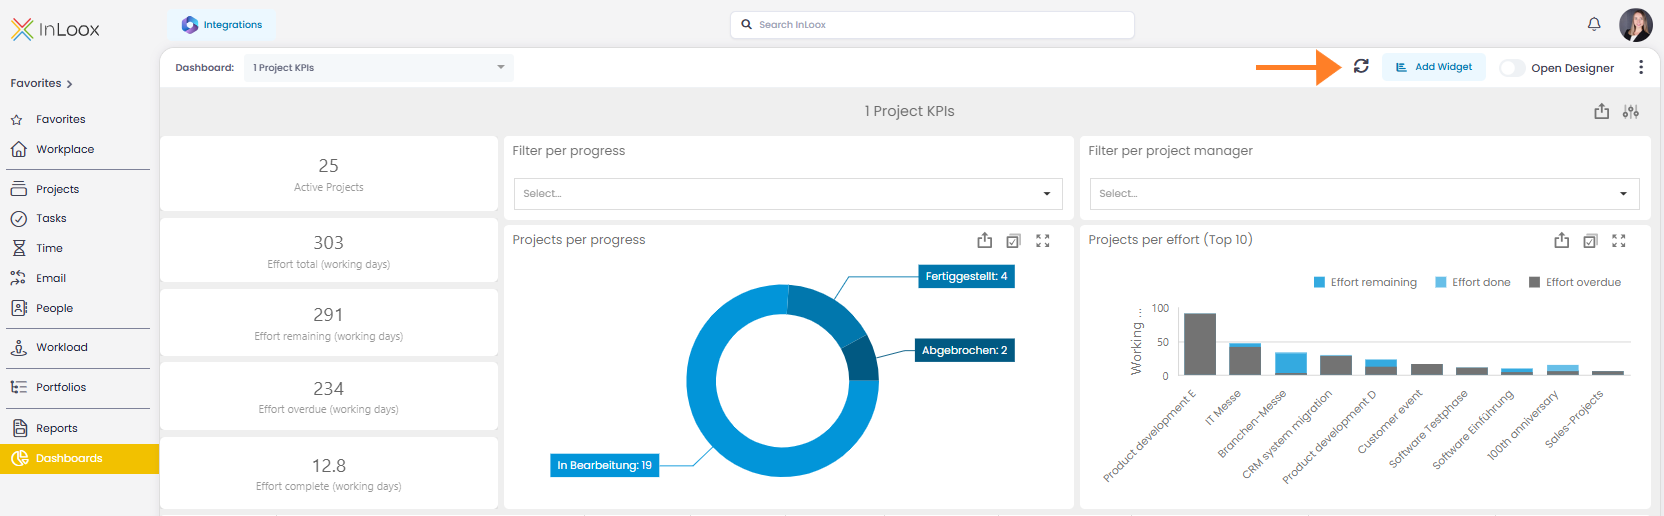
The InLoox project dashboard displays the most important key figures in the current project

info

You can decide whether to customize the dashboard individually per project, or define a customized version as the organization-wide standard. This way, teams benefit equally from consistent reporting and individual insights.

warning

Dashboards are only available in the editions InLoox Enterprise, Enterprise Plus, and On-Prem.

New permissions for dashboards

Alongside the new features, permissions have been expanded to give you more control. You can now precisely define who may only view dashboards and who may actively edit them. The following rights are available:

  • Read project dashboard
  • Edit project dashboard
  • Read dashboards
  • Edit dashboards

Help articles: Dashboards | Permissions

Dashboard: New Template "Project Health"

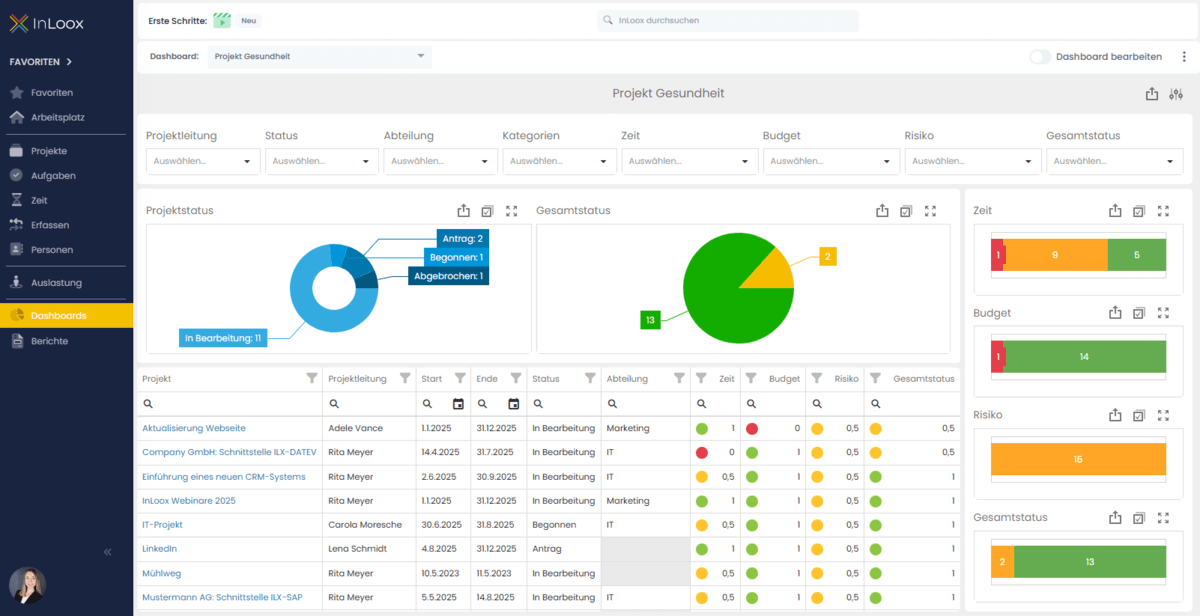
With the new "Project Health" dashboard template, you can keep track of the overall status of your projects at all times – compact, visual, and insightful. The dashboard displays the status from three key perspectives:

  • Time: Based on the time alerts "Planned end date exceeded" and "Project end date exceeded"
  • Budget: Compares planned vs. actual values. Using the dashboard parameter settings (button at the very top right), you can customize the percentage range for budget alerts
  • Risk: Evaluated according to the level of risk (set on the project manage page)

From these, an overall status is calculated as the average of the three values Time, Budget, and Risk.

You can download this and other templates under Templates and then import them into InLoox.

Dashboard "Project Health": Overall project status based on time, budget, and risk