Projects: Trend and History Data
A current figure tells you where a project stands. It does not tell you how the project got there. With InLoox 26.6, you can see how the KPIs of your projects develop over time, for example booked hours, planned duration, effort, and financial values, as well as your custom fields.
-
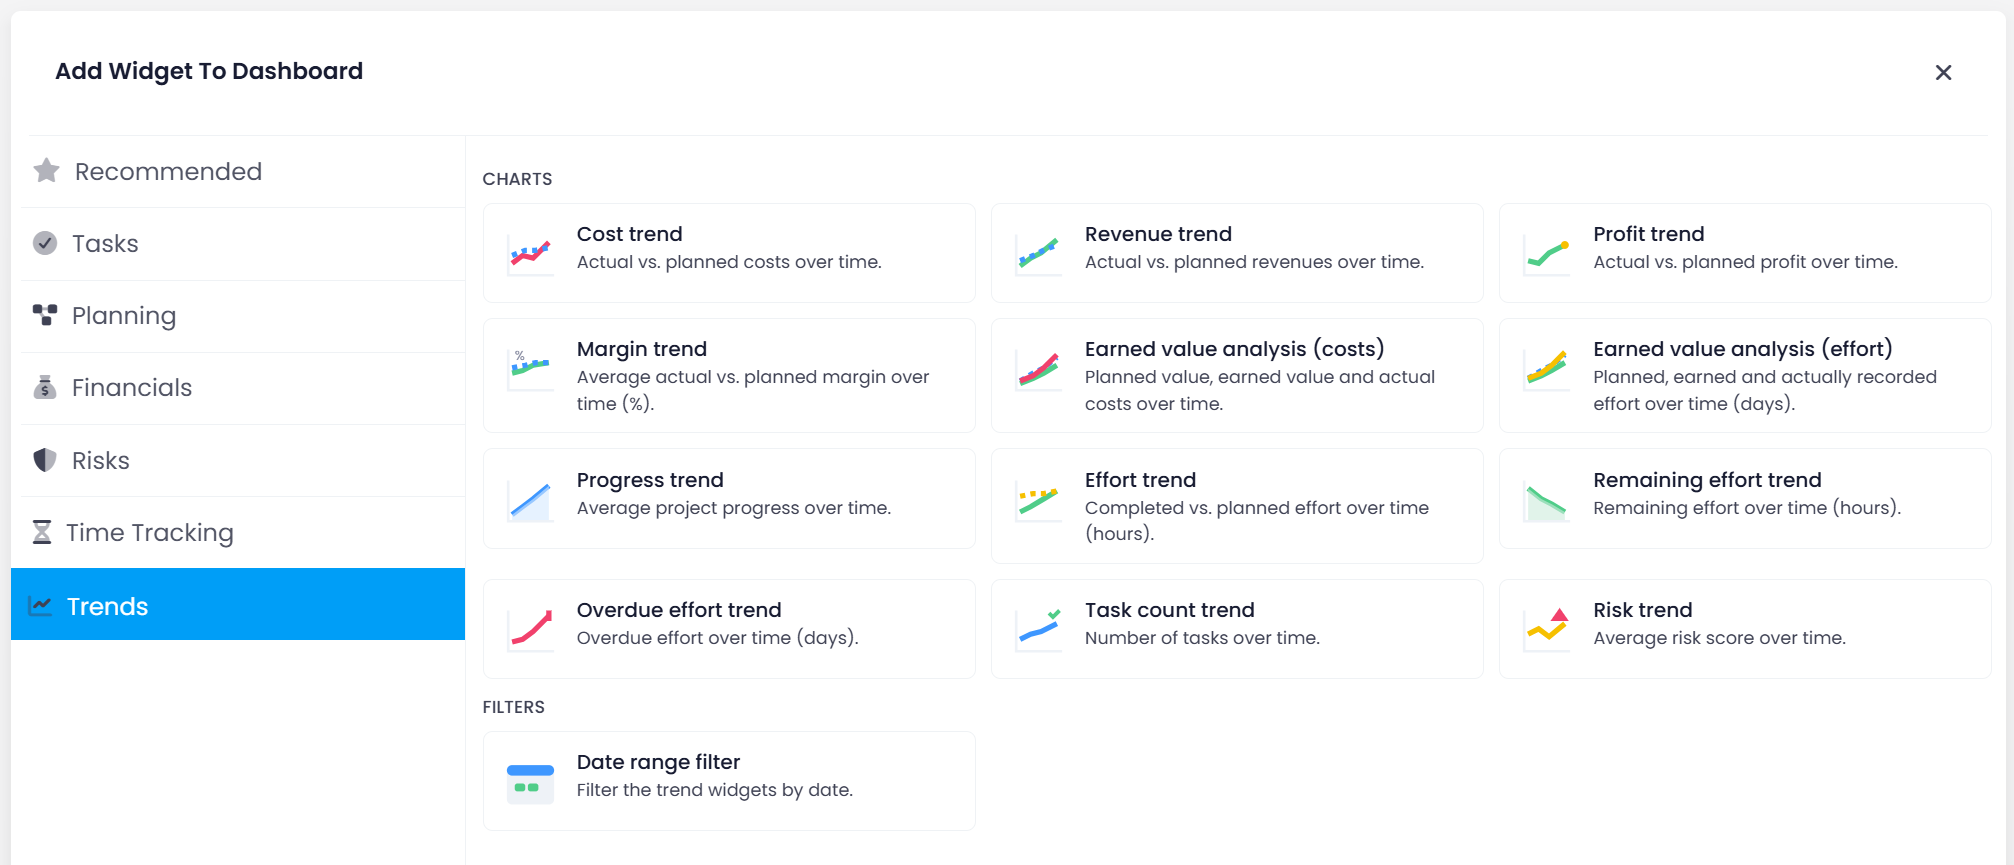
Trend widgets on the project dashboard: The new Trends widget category shows costs, revenue, profit, margin, progress, effort, remaining and overdue effort, task count, and risk as small line charts over time. A date range filter narrows the period.
-
Sparkline columns in the project list: Add a sparkline column via Choose columns to compare the development of many projects at a glance. By default, a sparkline covers the last 90 days.
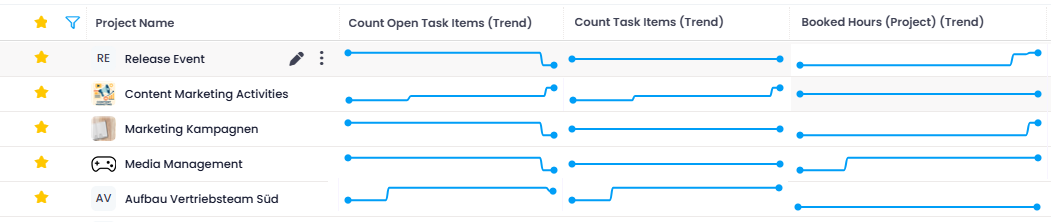
Example: Two projects both show 80% progress. The sparkline reveals that one climbed steadily, while the other has been stuck at 75% for two months. Same number, very different situation.
Trend and history data are available in InLoox Enterprise, InLoox Enterprise Plus, and InLoox Self-Hosted and require the Read Historic Data permission, which is enabled by default. Values are recorded once per night, so a new project shows a trend only after the first nightly run.
Help articles: Trend Widgets · KPI Trend Sparklines