Dashboards
General Information
- Project Dashboard and Multi-Project Dashboards are available in InLoox Enterprise, InLoox Enterprise Plus, and InLoox Self-Hosted editions.
- InLoox offers a dashboard within each project (available since InLoox 12.4, September 2025) as well as multi-project dashboards for cross-project analysis.
- Dashboards can be edited, saved as templates, downloaded, and uploaded.
- You need at least read or editing permissions to access dashboards and view data in widgets.
Access and Edit the Project Dashboard
Open a project and click the Dashboard tab. The project dashboard displays real-time project data. You can add widgets directly or open the Dashboard Designer to make more extensive edits.
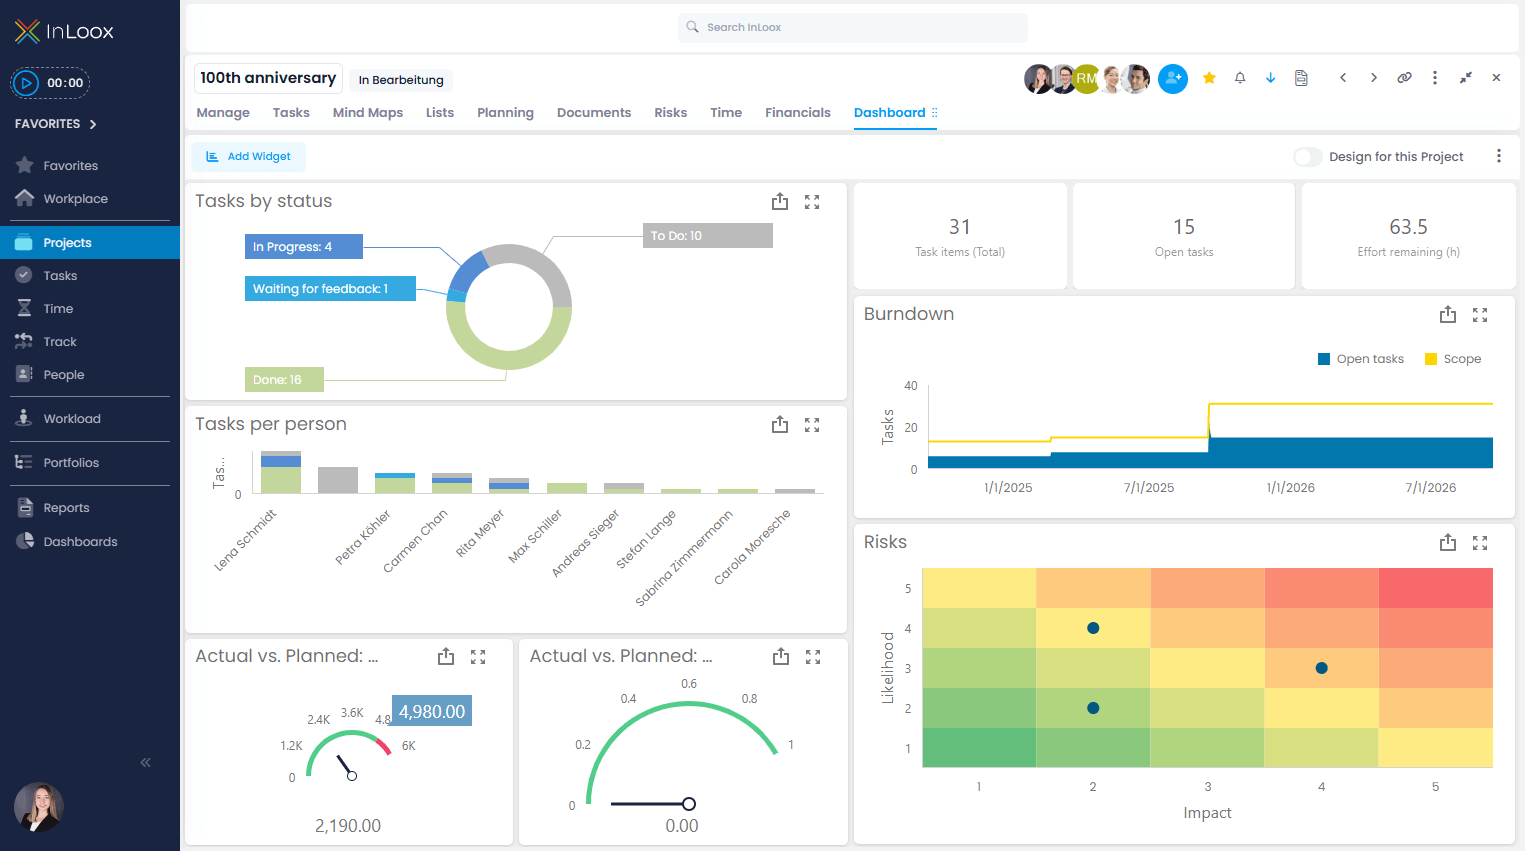
Project dashboard widgets include:
- Tasks by Status
- Tasks per Person
- Actual vs. Planned: Costs
- Actual vs. Planned: Benefits
- Task Items (Total)
- Open Tasks
- Effort Remaining (h)
- Burndown
- Risks
If widgets show no data, verify that the project contains data and that you have at least reading permissions.
Undo Changes to a Project Dashboard
To revert a project dashboard to its default state:
- Click the three-dot menu (⋯) in the dashboard toolbar.
- Select Reset Dashboard.
Turn a Project Dashboard into an Organizational Standard
To set a project dashboard as the default for your organization:
- Click the three-dot menu (⋯).
- Select Set as Organizational Default.
To revert to the original default:
- Click the three-dot menu (⋯).
- Select Reset Organization Default.
Access and Edit Multi-Project Dashboards
Click Dashboards in the left-hand menu.
Multi-Project Dashboard Templates
InLoox provides a set of ready-made dashboard templates for common use cases:
Right-click a preview image and select Open image in new tab to view it in full size.
| Template | Description | Preview |
|---|---|---|
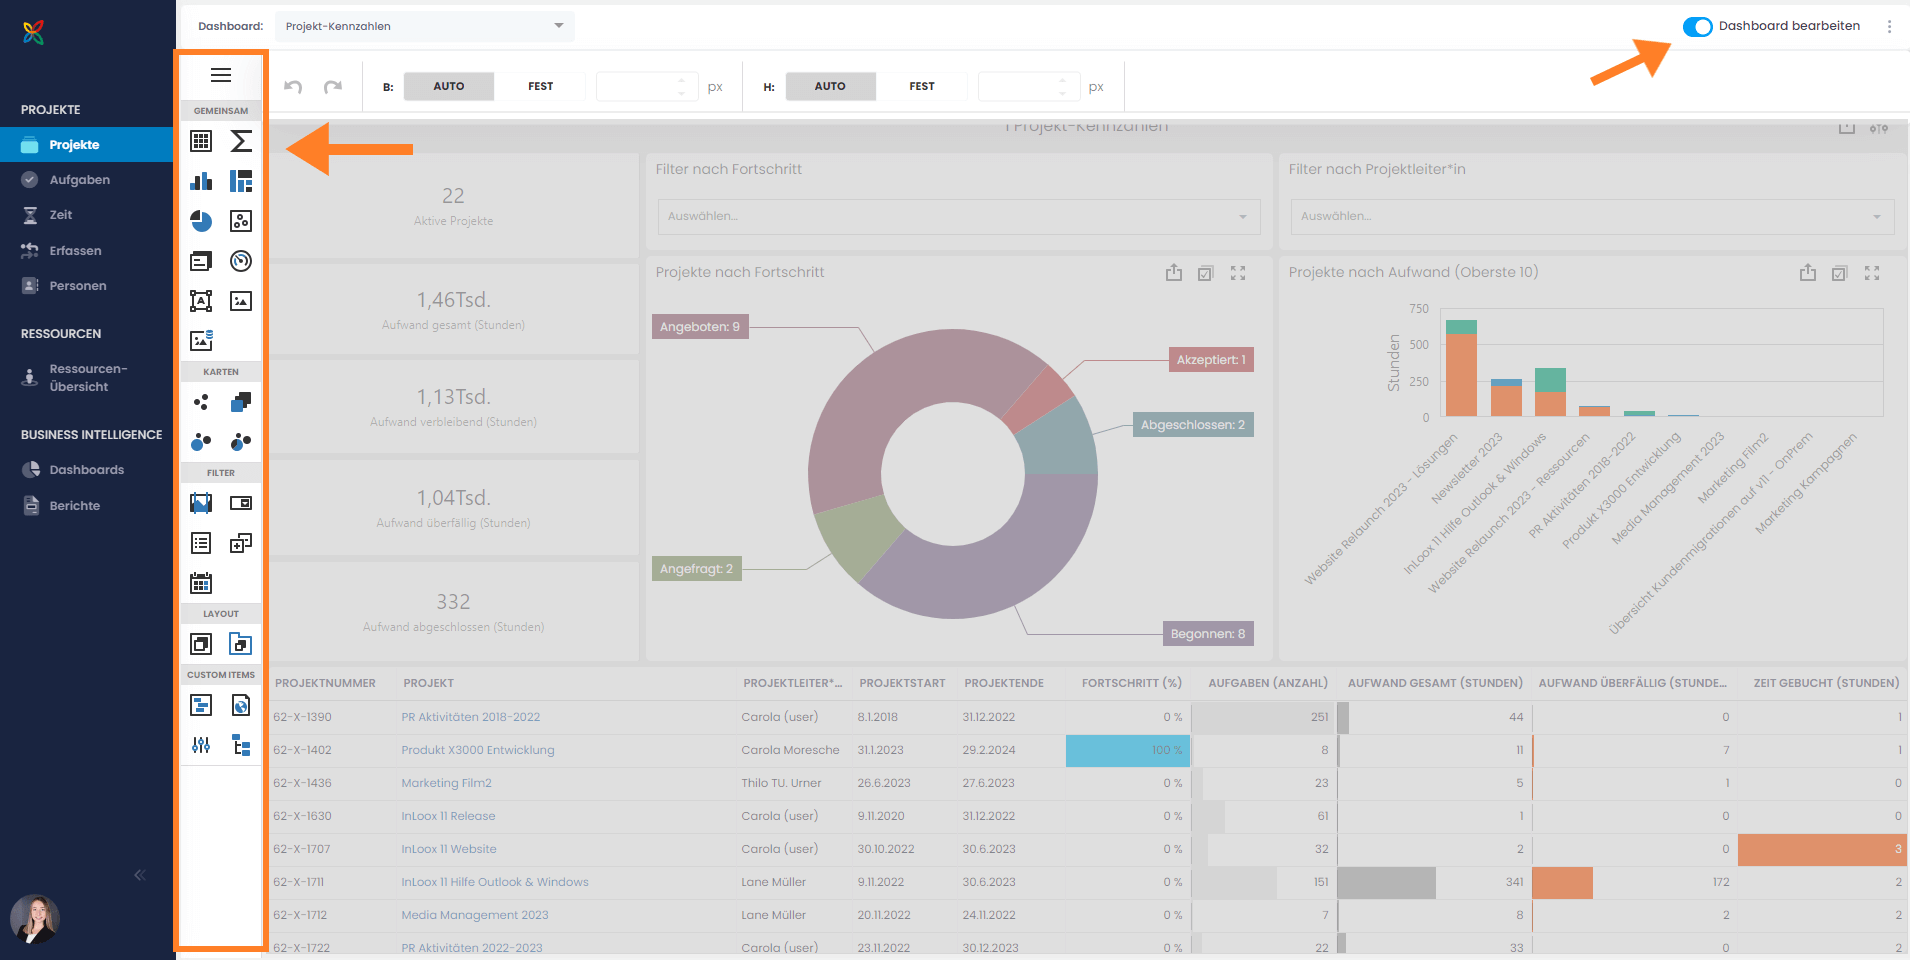
| Project KPIs | Overall overview of all projects with KPIs on count, progress, effort (planned, remaining, overdue, completed), and the largest projects by effort. | 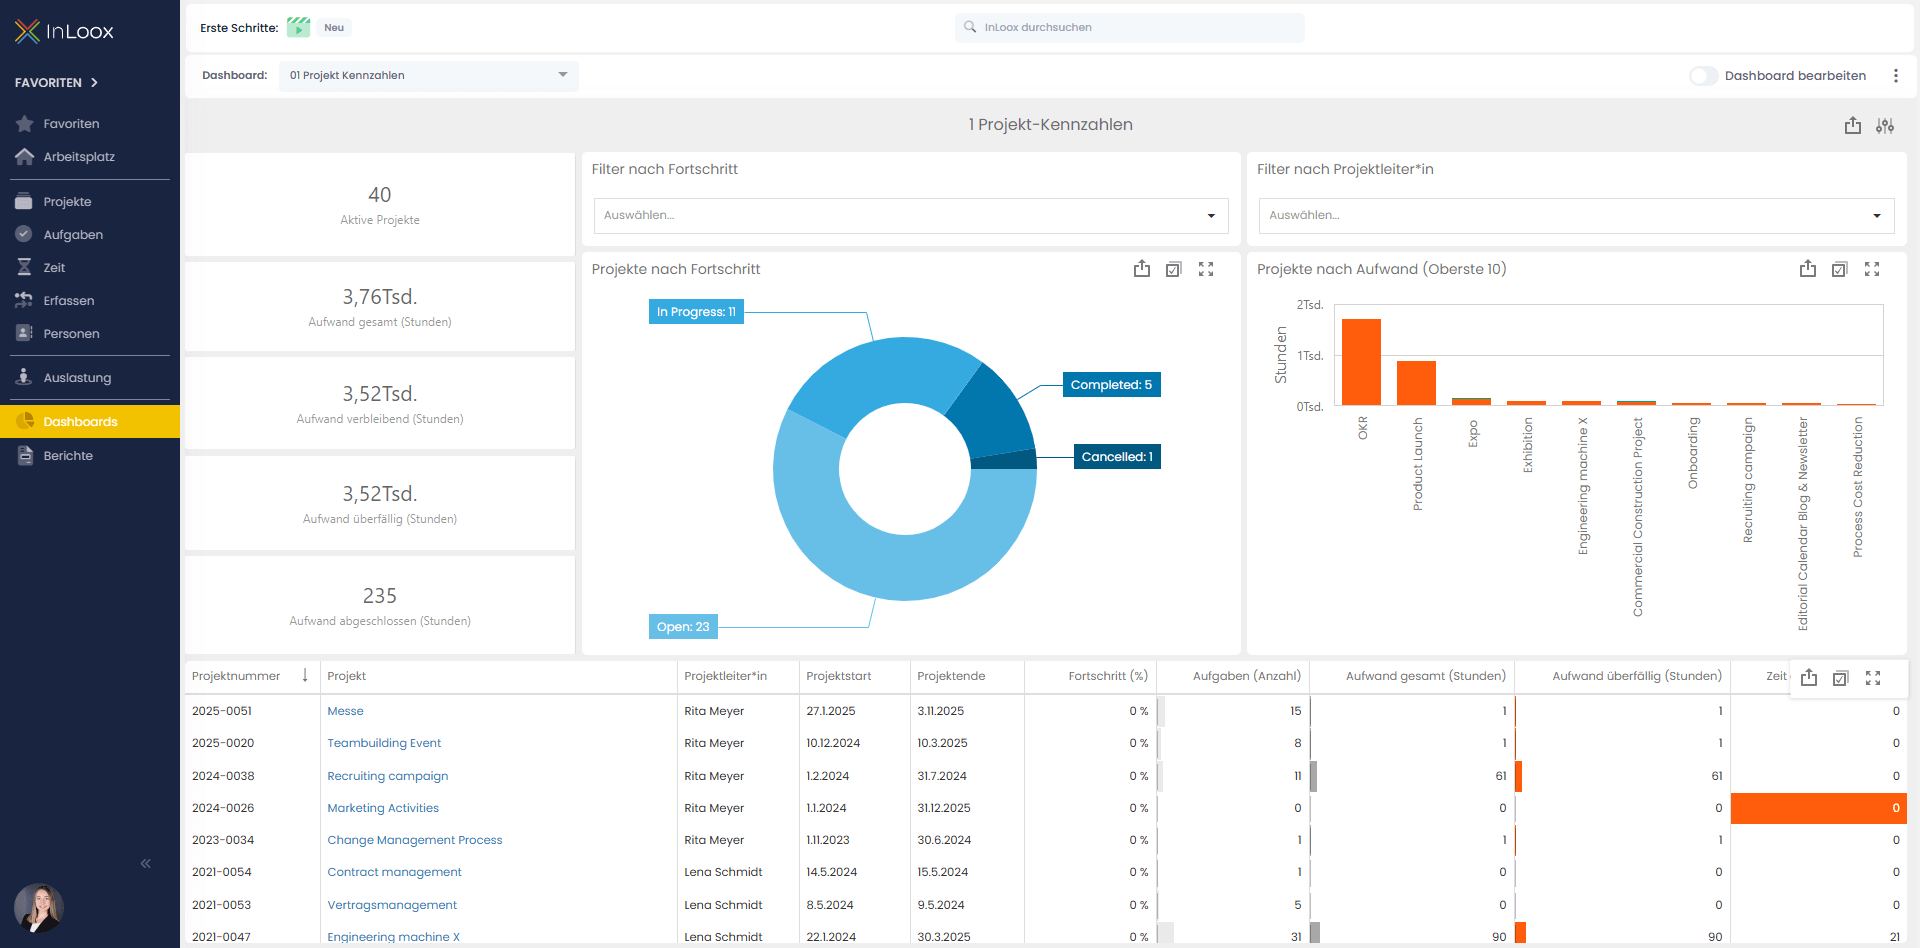 |
| Project Milestones | Shows all important achieved and upcoming milestones within a defined time period. Helps track project progress, spot delays, and keep an eye on key upcoming project stages. | 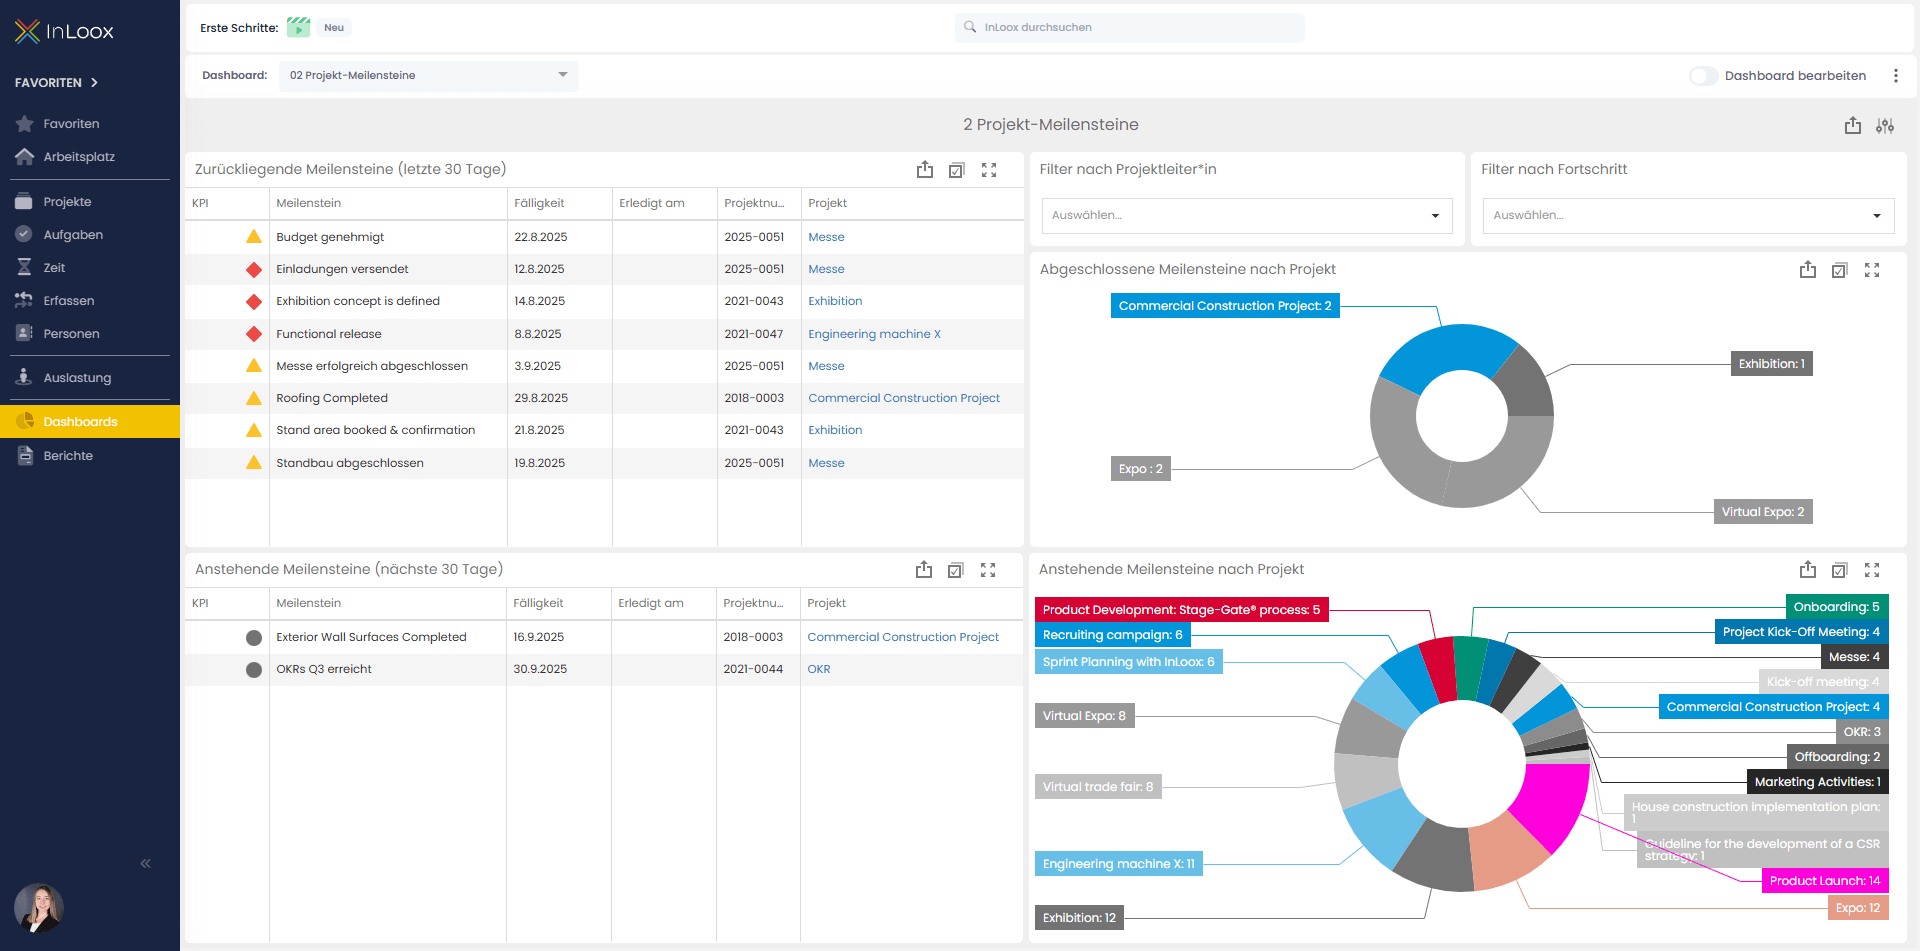 |
| Task Insights | Overview of all tasks across the organization, broken down by status, projects, and effort. Quickly identify open, in-progress, or overdue tasks and visualize task distribution across projects. | 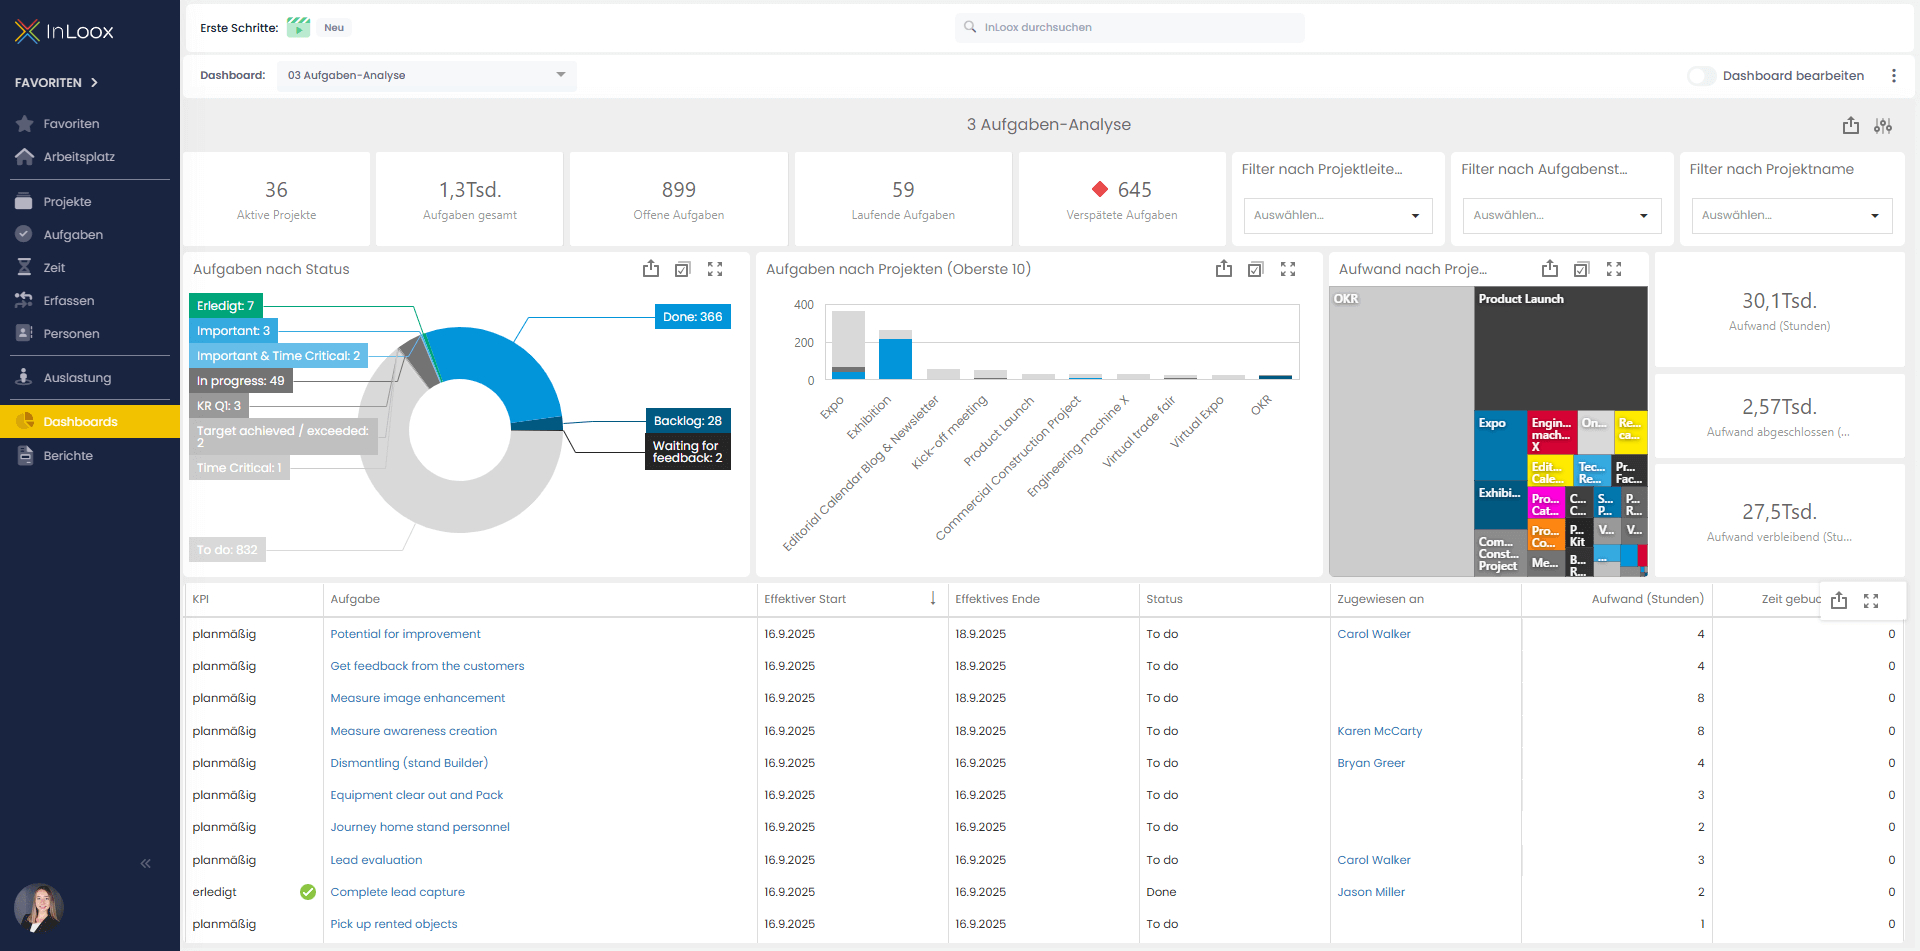 |
| Resource Insights | Overview of workload and task distribution by person, project, and status. Identify bottlenecks or overloaded team members and improve planning and allocation of tasks and effort. | 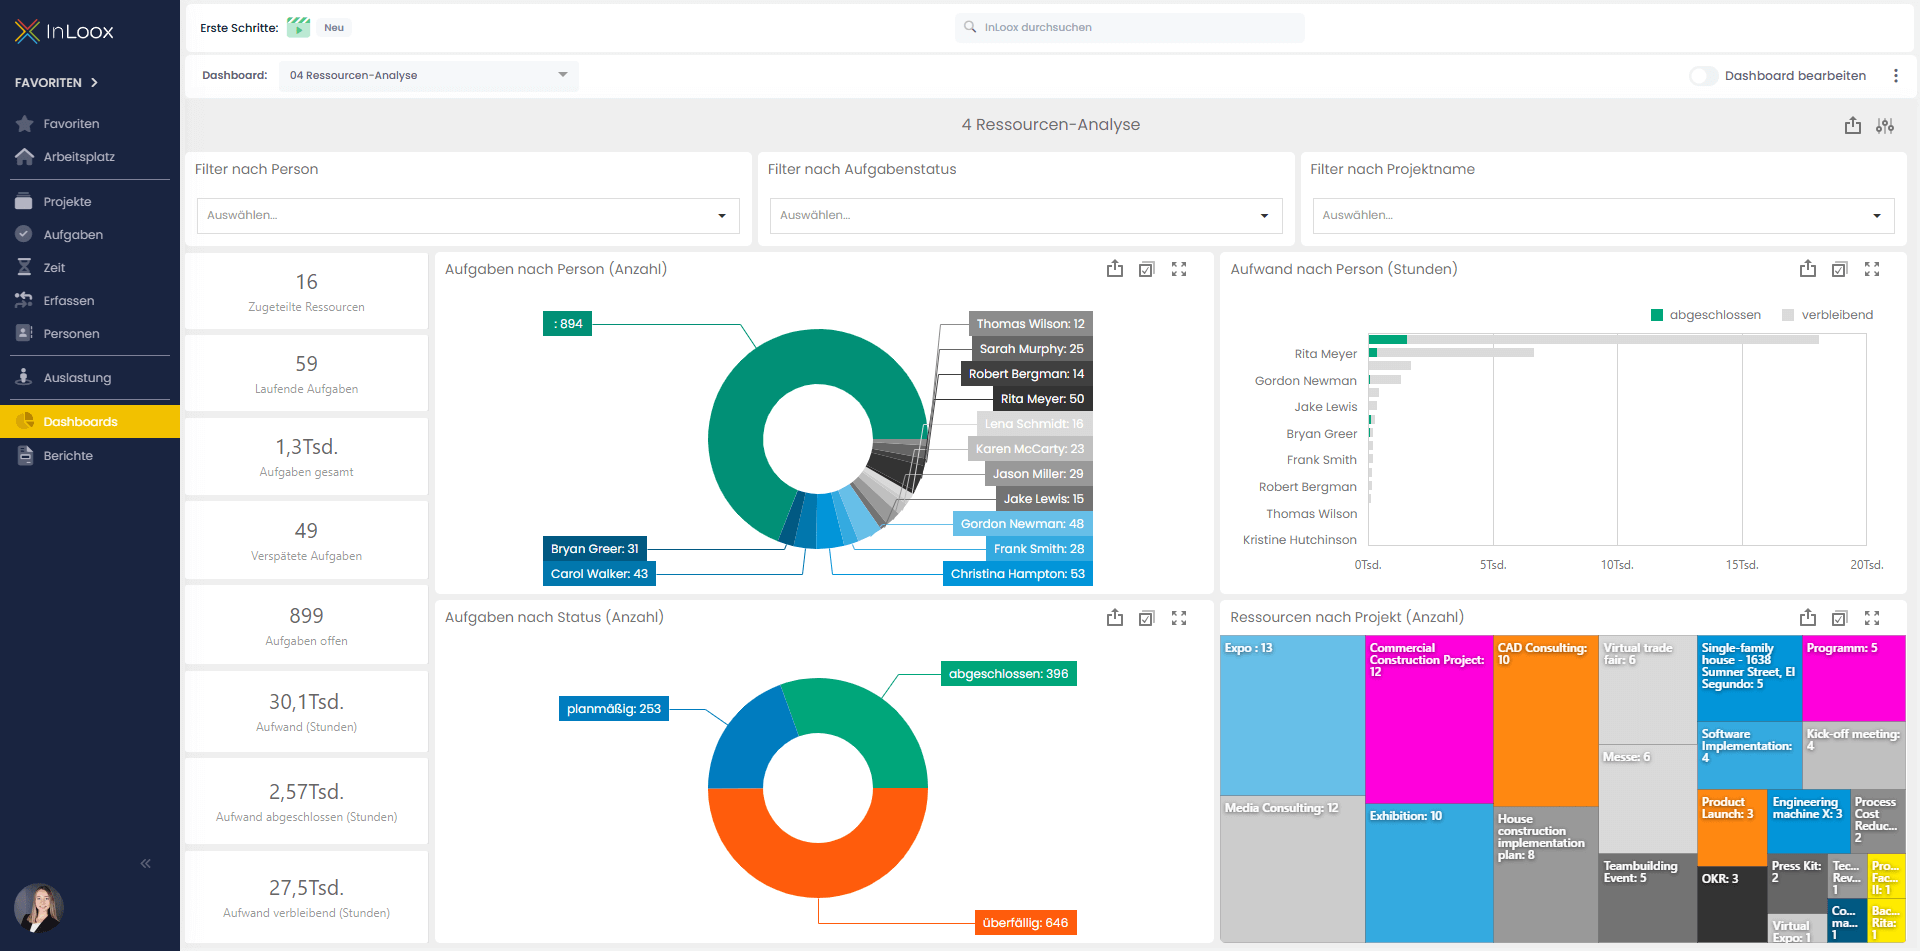 |
| Resource Effort Plan-Actual | Direct comparison of planned resource effort vs. actual tracked time for tasks. Identify where adjustments are needed and improve future effort estimates. | 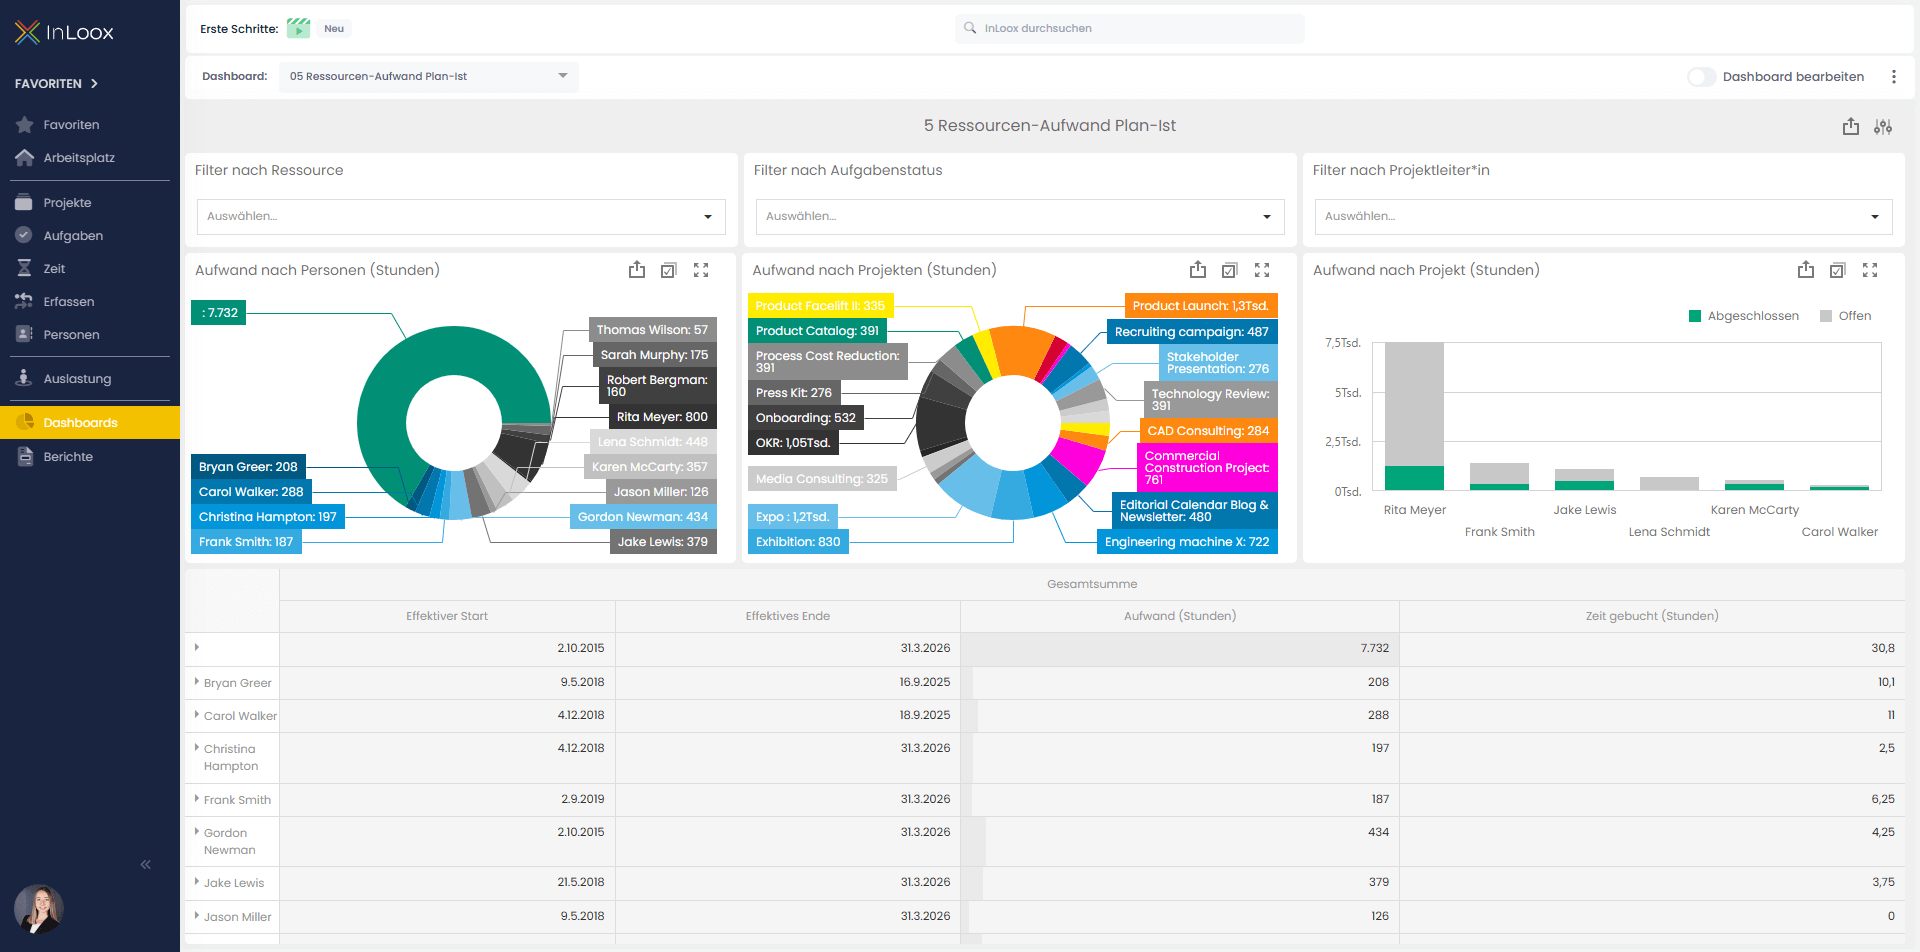 |
| Financials Plan-Actual | Comparison of planned vs. actual project costs and their distribution by project progress. Spot deviations early, identify cost drivers, and support financial control and budget management. | 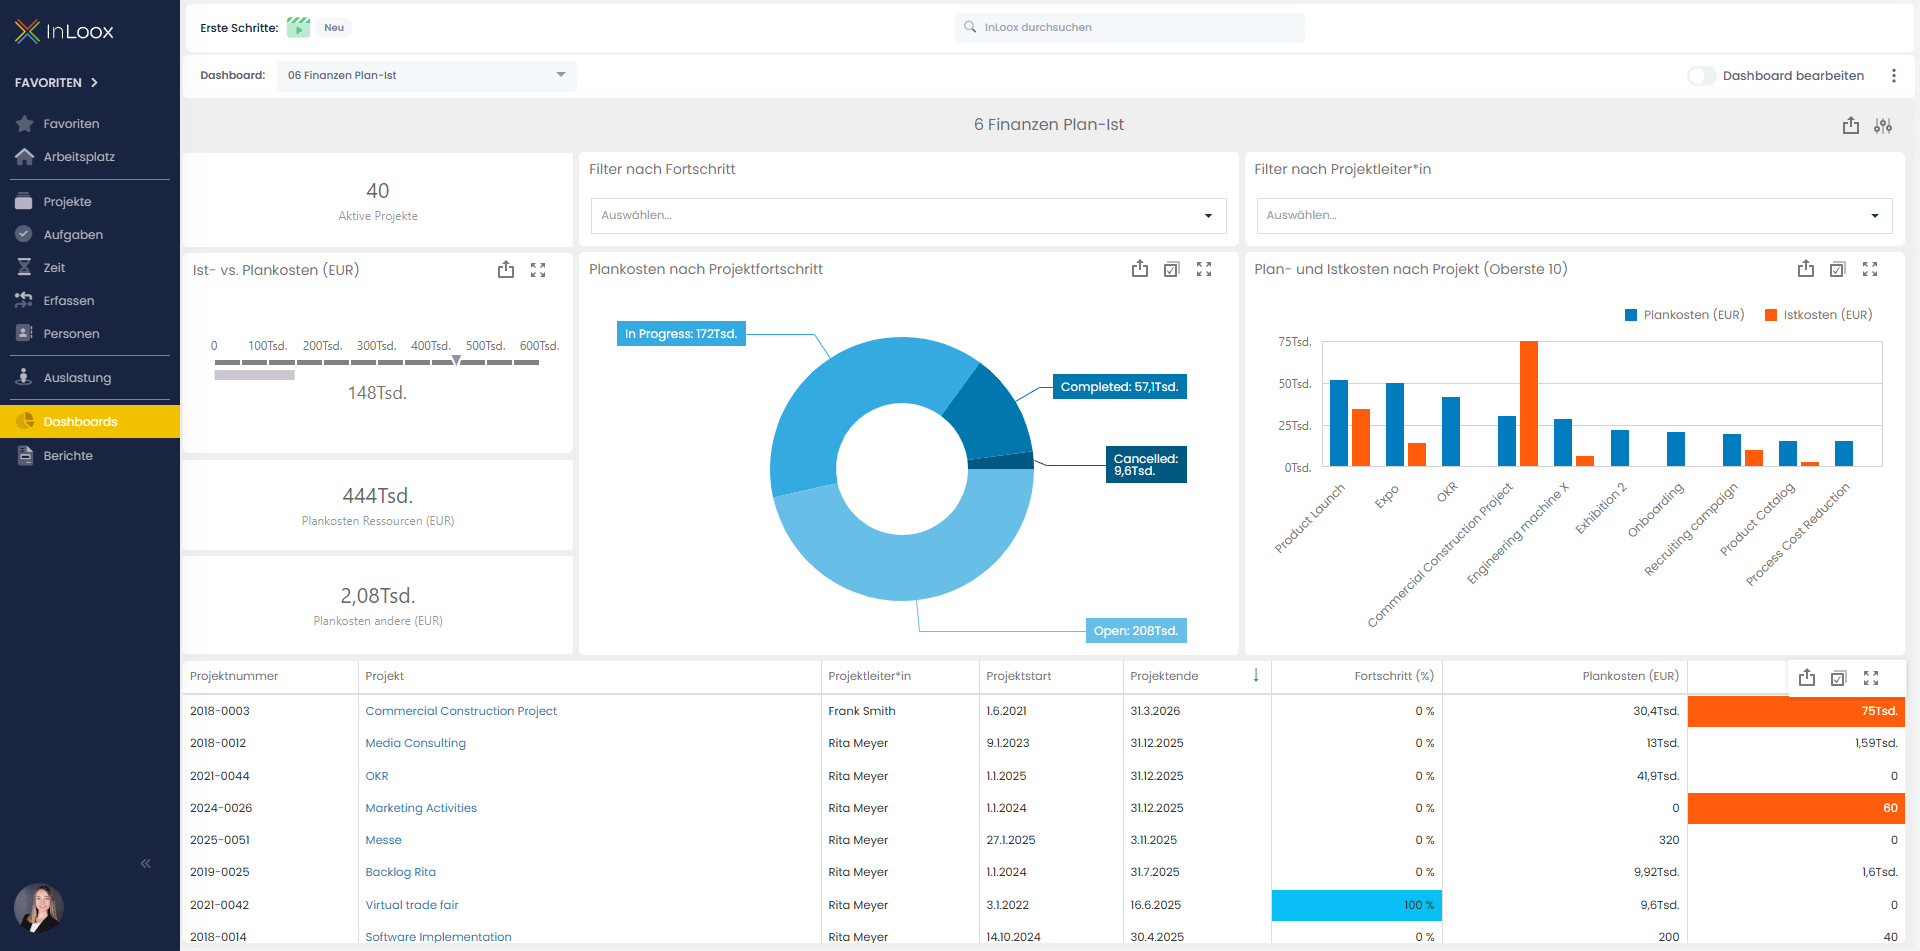 |
| Project Value | Designed for portfolio management, this dashboard presents projects in a matrix based on the key dimensions risk and value, each on a scale of 1 to 10. | 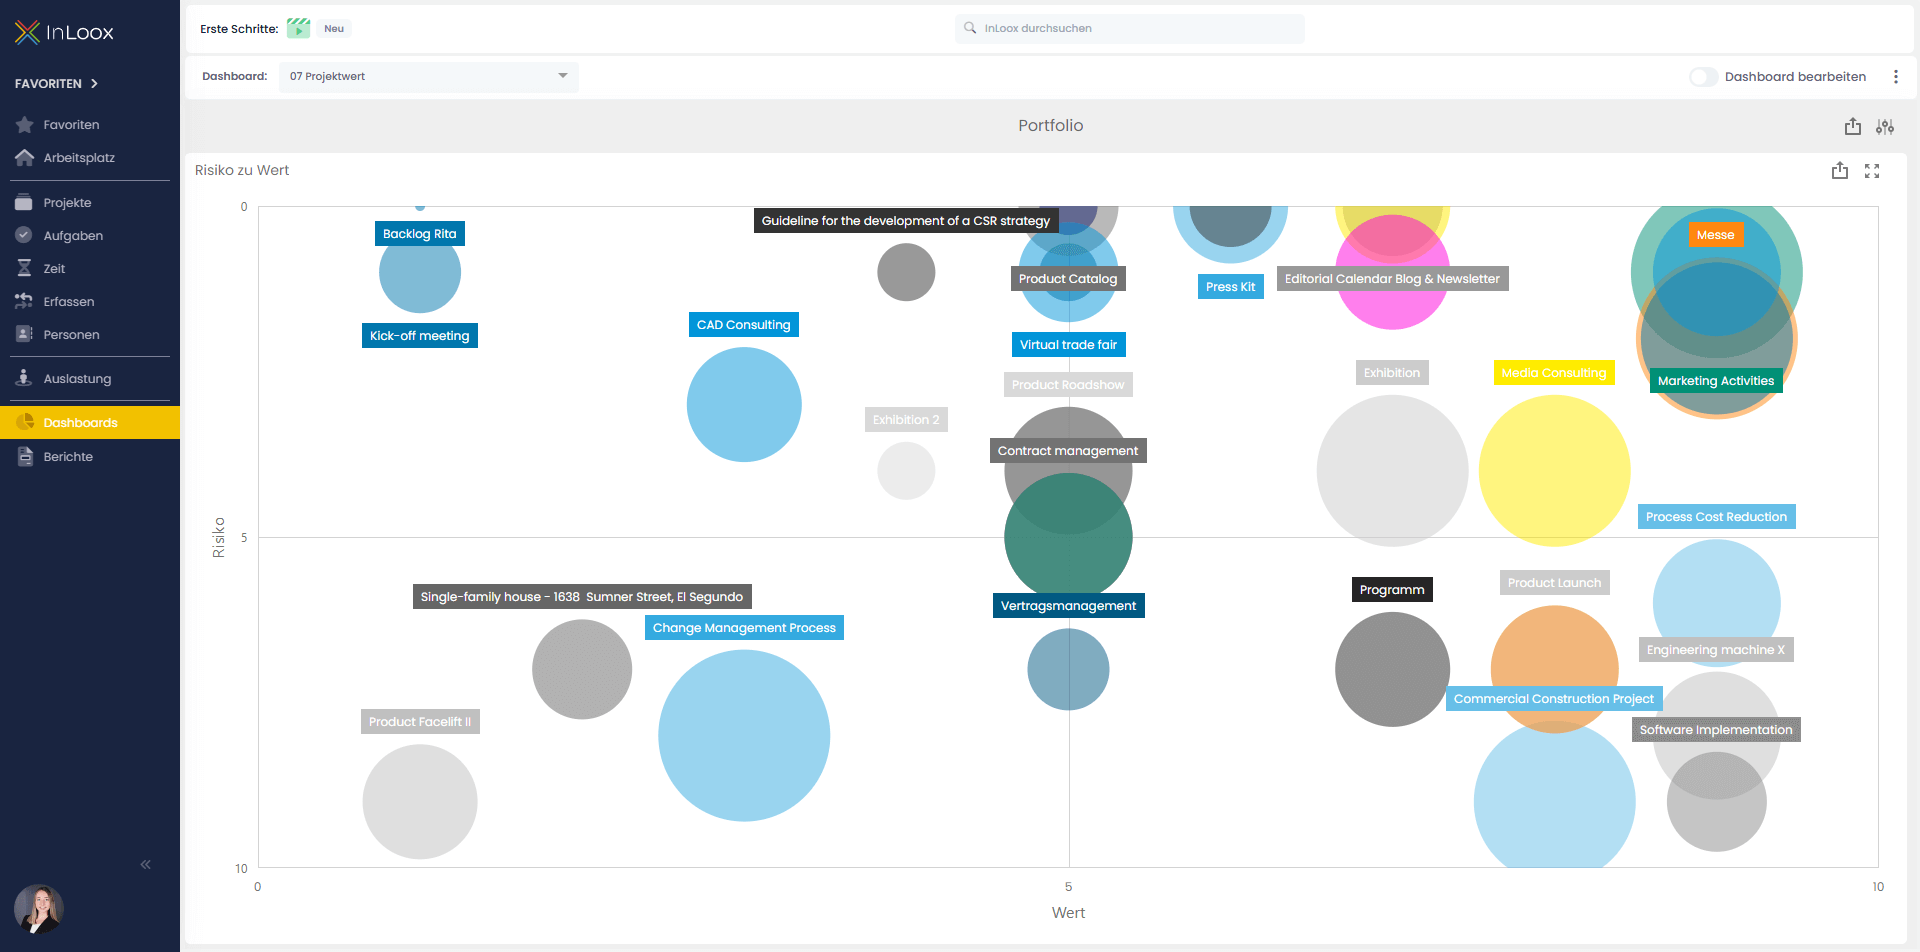 |
| Budget Overview | Compilation of planned and actual expenditures, benefits, and margins by groups, projects, and time periods. Quickly assess the financial situation and identify deviations between plan and actuals. | 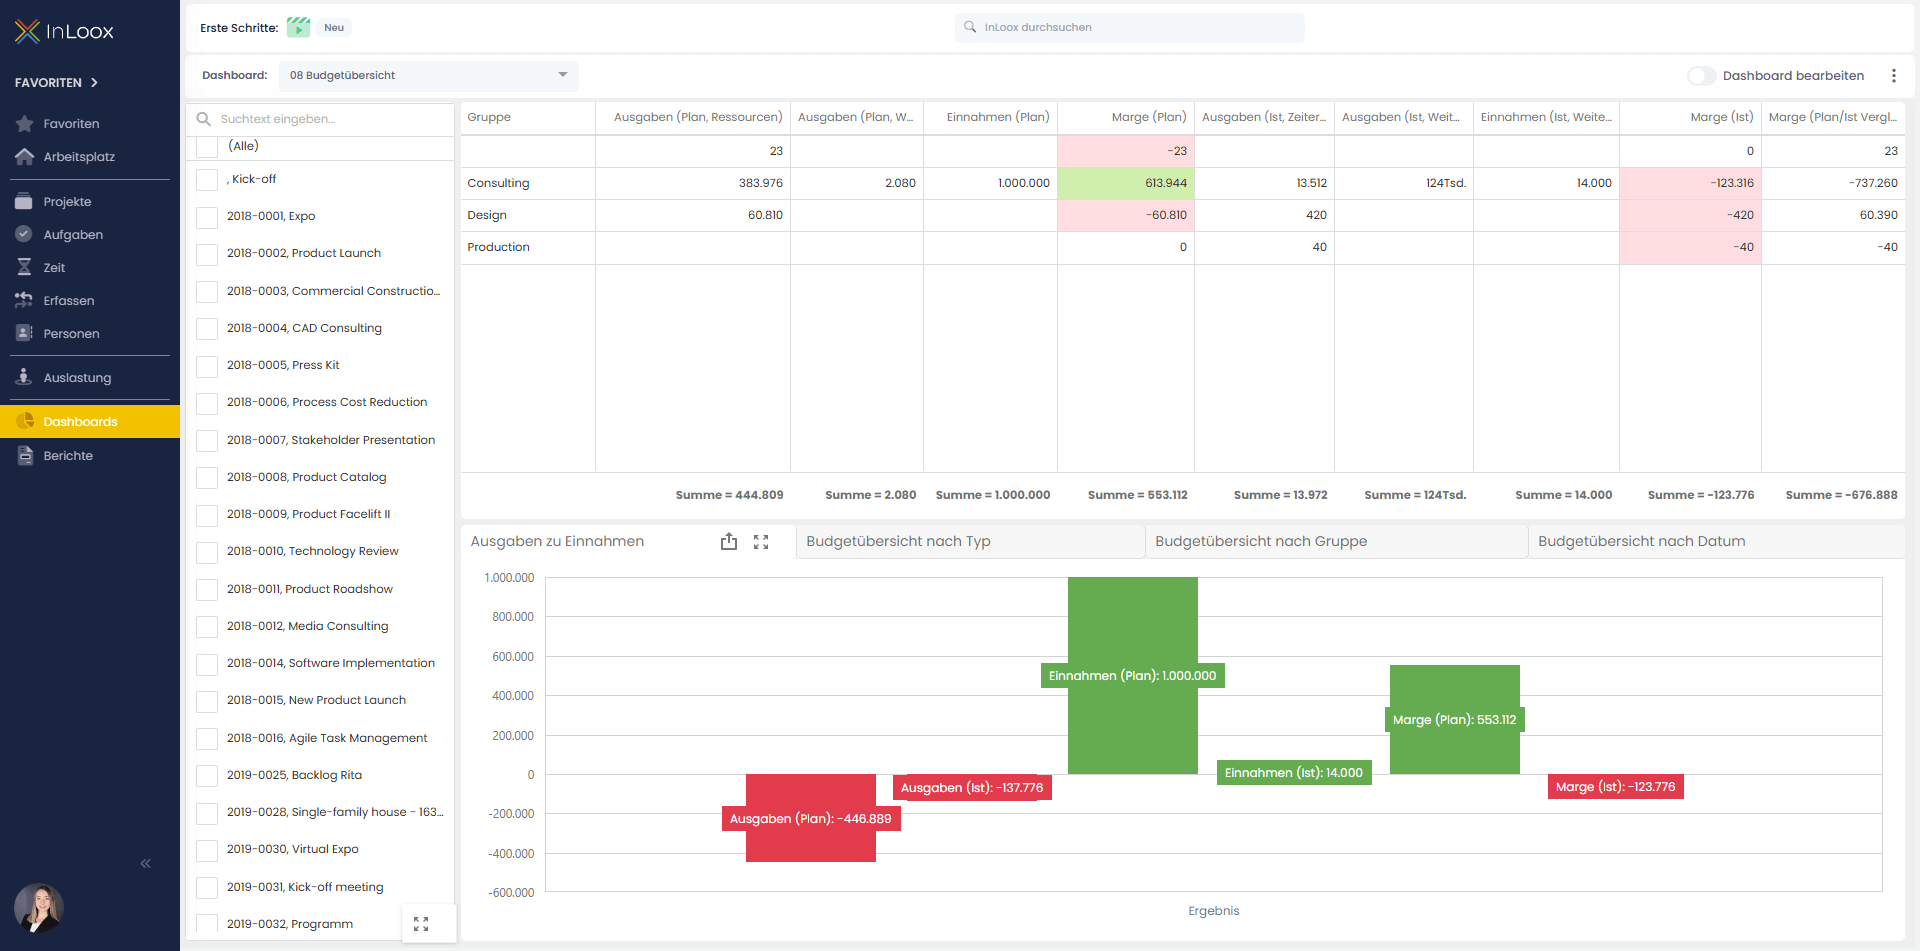 |
| Project Health | Current health status of all projects based on criteria such as status, time, budget, risk, and overall status. Spot critical projects early, maintain an overview of progress and risks, and take targeted action. | 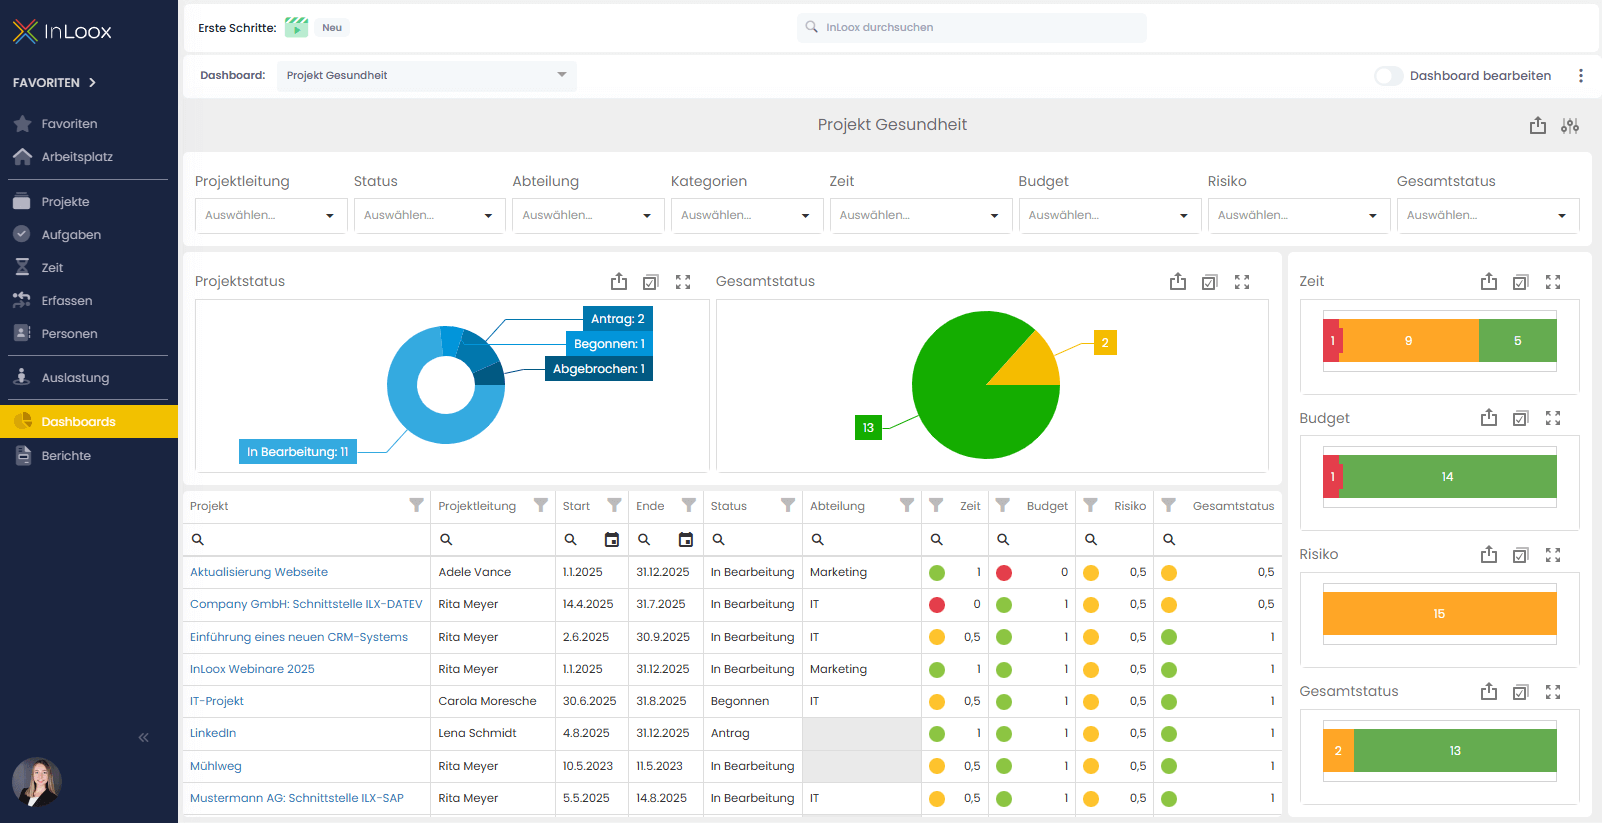 |
Existing customers may still have older dashboard templates. You can download the latest templates from the InLoox website and import them into your environment.
Download & Upload Dashboards
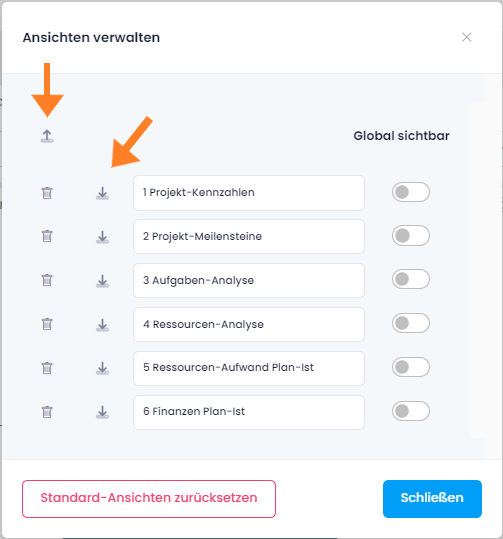
Manage Dashboard Views
- Click the three-dot menu (⋯).
- Select Manage Views.

From here, you can upload and download dashboard views as JSON files.
Export Dashboard Content
To export the dashboard itself (not the view definition), click the export icon and choose one of the following formats:
- Image
- Excel

Dashboard Widgets
Widgets are small, configurable units that display specific data on a dashboard. You can add widgets to any existing dashboard to customize the information shown.
Add Widgets to a Project Dashboard
- Open the project and navigate to the Dashboard tab.
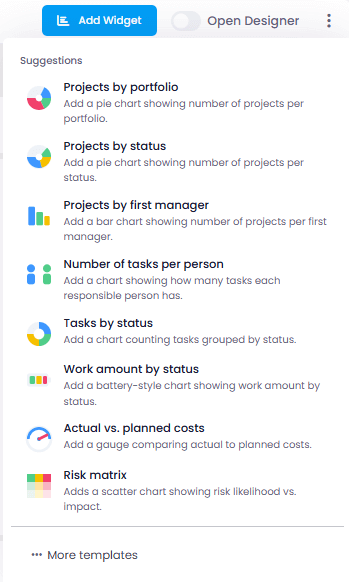
- Click Add Widget in the dashboard toolbar.
- Browse or search the available widgets.
- Select the widget you want to add.
- The widget appears on the dashboard canvas.
- Drag the widget to reposition it.
- Resize the widget by dragging its edges.
- Configure widget-specific settings by clicking the widget's settings icon.
Dashboard Designer
The Dashboard Designer is a powerful tool for creating and customizing multi-project dashboards. Use it to add, remove, resize, and rearrange items, connect data sources, apply global filters, and configure advanced dashboard settings.
To open the Dashboard Designer, click the Edit Dashboard slider on any existing dashboard.
For detailed instructions on all Dashboard Designer features, see the Dashboard Designer documentation.